In short
Per kWh leaving the installation, solar and onshore wind are now among the cheapest new sources. A new nuclear plant costs about double. An existing nuclear plant that stays open longer is cheap, though. That price leaves out the grid, reserve capacity and storage. This is where the studies differ most. How much accident and waste risk a society accepts is a choice. Figures do not settle it.
Often heard: what is true?
| What you hear | Is it true? | Why |
|---|---|---|
| "Nuclear power is the cheapest electricity." | It depends | An existing nuclear plant that stays open longer is cheap. According to the NEA, a new one costs about double onshore wind or solar. |
| "Solar and wind are already the cheapest electricity." | Partly true | For new builds this is true per kWh leaving the installation, in the studies that compare sources. According to the NEA, an existing nuclear plant that stays open longer is cheaper still. Costs for the grid, storage and reserve capacity come on top. |
| "Solar and wind give nothing when it is dark and still, so you always need power plants." | Partly true | Reserve capacity is always needed. It can also come from storage, imports and demand response. What that costs differs from study to study. |
| "Nuclear waste is an unsolvable problem." | Partly true | Belgium chose deep geological disposal. According to NIRAS, the project will take many more decades. The sources consulted name no chosen site. |
| "Every nuclear plant is as dangerous as Chernobyl." | False | Per kWh, Our World in Data counts far fewer deaths than for coal and gas. That average says little about the risk of a rare, severe accident, though. |
| "Wind turbines and solar panels get more support than they earn." | It depends | All technologies received and still receive support, including the extended nuclear plants. As far as we know, no total figure compares them fairly. |
What "cost per kWh" means
Studies compare sources using the LCOE (levelised cost of electricity). This is the average price per MWh at which a power plant earns back all its costs over its whole life: construction, maintenance, fuel and decommissioning. One MWh is 1,000 kWh.
Future costs count for less. The discount rate sets how much less. The NEA, the OECD's Nuclear Energy Agency, uses 5% a year above inflation. It writes that such assumptions are never neutral. They weigh most for installations with high construction costs, such as nuclear plants and wind farms.
The LCOE says nothing about when the electricity arrives. It also says nothing about the costs of the grid, reserve capacity and storage.
The capacity factor is the share of the year in which an installation would run at full power. It decides how much capacity you have to build.
Worked example (illustrative)
You want to generate 1 TWh a year, so 1,000,000 MWh. A year has 8,760 hours. The capacity needed is 1,000,000 divided by (8,760 × capacity factor). The capacity factors are the NEA's assumptions for Belgium. Nuclear plant (85%): about 134 MW. Offshore wind (37%): about 309 MW. Onshore wind (25%): about 457 MW. Solar farm (11%): about 1,038 MW. This only shows how much you build for the same number of kWh a year, not what it costs or when the electricity arrives.
What four studies find
The NEA and the American research institute EPRI published The Costs of Generating Electricity 2025 in September 2026. It is the latest edition of a series that began in 1983. The report uses US dollars and covers 21 countries, including Belgium. The NEA is a nuclear energy agency. EPRI is a research institute of the energy industry.
| Technology | NEA LCOE (USD/MWh, 21 countries) | NEA, Belgium | Capacity factor (Belgium) | Construction time (NEA assumption) | Lifecycle CO2 (g CO2e/kWh, IPCC) |
|---|---|---|---|---|---|
| New large nuclear plant | 95 to 168 (median 140) | 163 | 85% (fixed assumption) | 6 to 8 years | 12 |
| Existing plant, 10 years longer | 39 to 64 | 50 | 85% | 2 years of work | 12 |
| Onshore wind | 36 to 141 (median 59) | 74 | 25% | 2 years | 11 |
| Offshore wind | 83 to 247 (median 115) | 120 | 37% | 3 to 4 years | 12 |
| Solar farm | 33 to 124 (median 68) | 96 | 11% | 1 year | 48 |
The NEA report gives no price year for the dollar. The capacity factors are input values from the NEA and EPRI, not measured Belgian figures. The CO2 figures are medians from the 2014 IPCC report (AR5). The "Construction time" column gives the NEA's assumption, not a measured time.
Three other studies give a similar ranking, with their own assumptions.
- IRENA (renewable energy agency, 2025, in 2025 dollars per MWh): global weighted average of 33 for onshore wind, 44 for solar and 78 for offshore wind. Capacity factors: 36%, 16% and 41%. In China, onshore wind costs 27 and offshore wind 49. In the US, offshore wind costs 141.
- Lazard (American investment bank, July 2026, US, dollars per MWh, without subsidies, 60% debt at 8% and 40% equity at 12%): solar 40 to 98, onshore wind 37 to 99, offshore wind 105 to 167 and a new nuclear plant 175 to 255. That last figure follows from the American Vogtle project.
- Fraunhofer ISE (German research institute, July 2024, Germany, 2024 euros): onshore wind 4.3 to 9.2 euro cents per kWh, offshore wind 5.5 to 10.3, solar 4.1 to 14.4 and a new nuclear plant 13.6 to 49.0. That last figure does not include final disposal. 1 euro cent per kWh is 10 euros per MWh.
For each source, the result depends on different factors. For nuclear power, construction cost counts: the NEA now sees 8,760 to 14,940 dollars per kW, and 2,487 to 6,791 if standard series come. For solar and wind, the capacity factor counts (for solar, 26% in Australia against 11% in Belgium), and so does the interest rate. For a series of standardised large nuclear plants ("NOAK"), the NEA sees 56 to 87 dollars per MWh. Such a series has not yet been built in the West.
What the LCOE leaves out: the costs of the whole system
The system is the power plants, grid, storage, imports and consumption together. The NEA writes that no measure exists that assigns system costs fairly to a single technology.
- Heptonstall and Gross (Nature Energy, 2021) reviewed the literature. With a low share of solar and wind, the costs of fitting them into the grid are small. With a high share there is less evidence and the estimates diverge more, because they depend on the price of flexibility (storage, interconnectors, demand response).
- Sepulveda and colleagues (Joule, 2018) found with models that "firm" low-carbon sources make a fully carbon-free grid 10% to 62% cheaper. These include nuclear power, gas with CO2 capture and biomass. Demand response complements these sources.
- Brown and colleagues (Renewable and Sustainable Energy Reviews, 2018) responded to Heard and colleagues (2017), who judge a grid with only renewable sources unfeasible. They dispute that and point to technical solutions.
- Fraunhofer writes that in a grid with many renewable sources, a nuclear plant becomes much more expensive than gas or hydrogen plants, because nuclear plants can only be regulated to a limited extent. The NEA sees the same mechanism: a nuclear plant that runs fewer hours becomes more expensive per kWh. The NEA reaches a different conclusion. In its Swiss example, the system with longer-running existing nuclear plants was the cheapest.
- Lazard finds that solar and wind, even with the costs of reserve capacity, still compete with new gas plants in the US.
The NEA points out that a lot of solar at the same moment pushes prices down. The surplus sometimes has to be curtailed. That raises the cost per usable kWh. Interconnectors with neighbouring countries help less when the same weather prevails there.
When is each source cheaper?
- Nuclear power: if existing nuclear plants keep running, if new builds succeed in series and without delay, at low interest rates and when little flexibility exists elsewhere.
- Solar and onshore wind: at good sites, at low interest rates and as long as their share stays small or there is plenty of flexibility.
- Offshore wind: in strong wind. The NEA calls capacity factors above 50% attractive, but the construction cost stays high.
Construction time and overruns
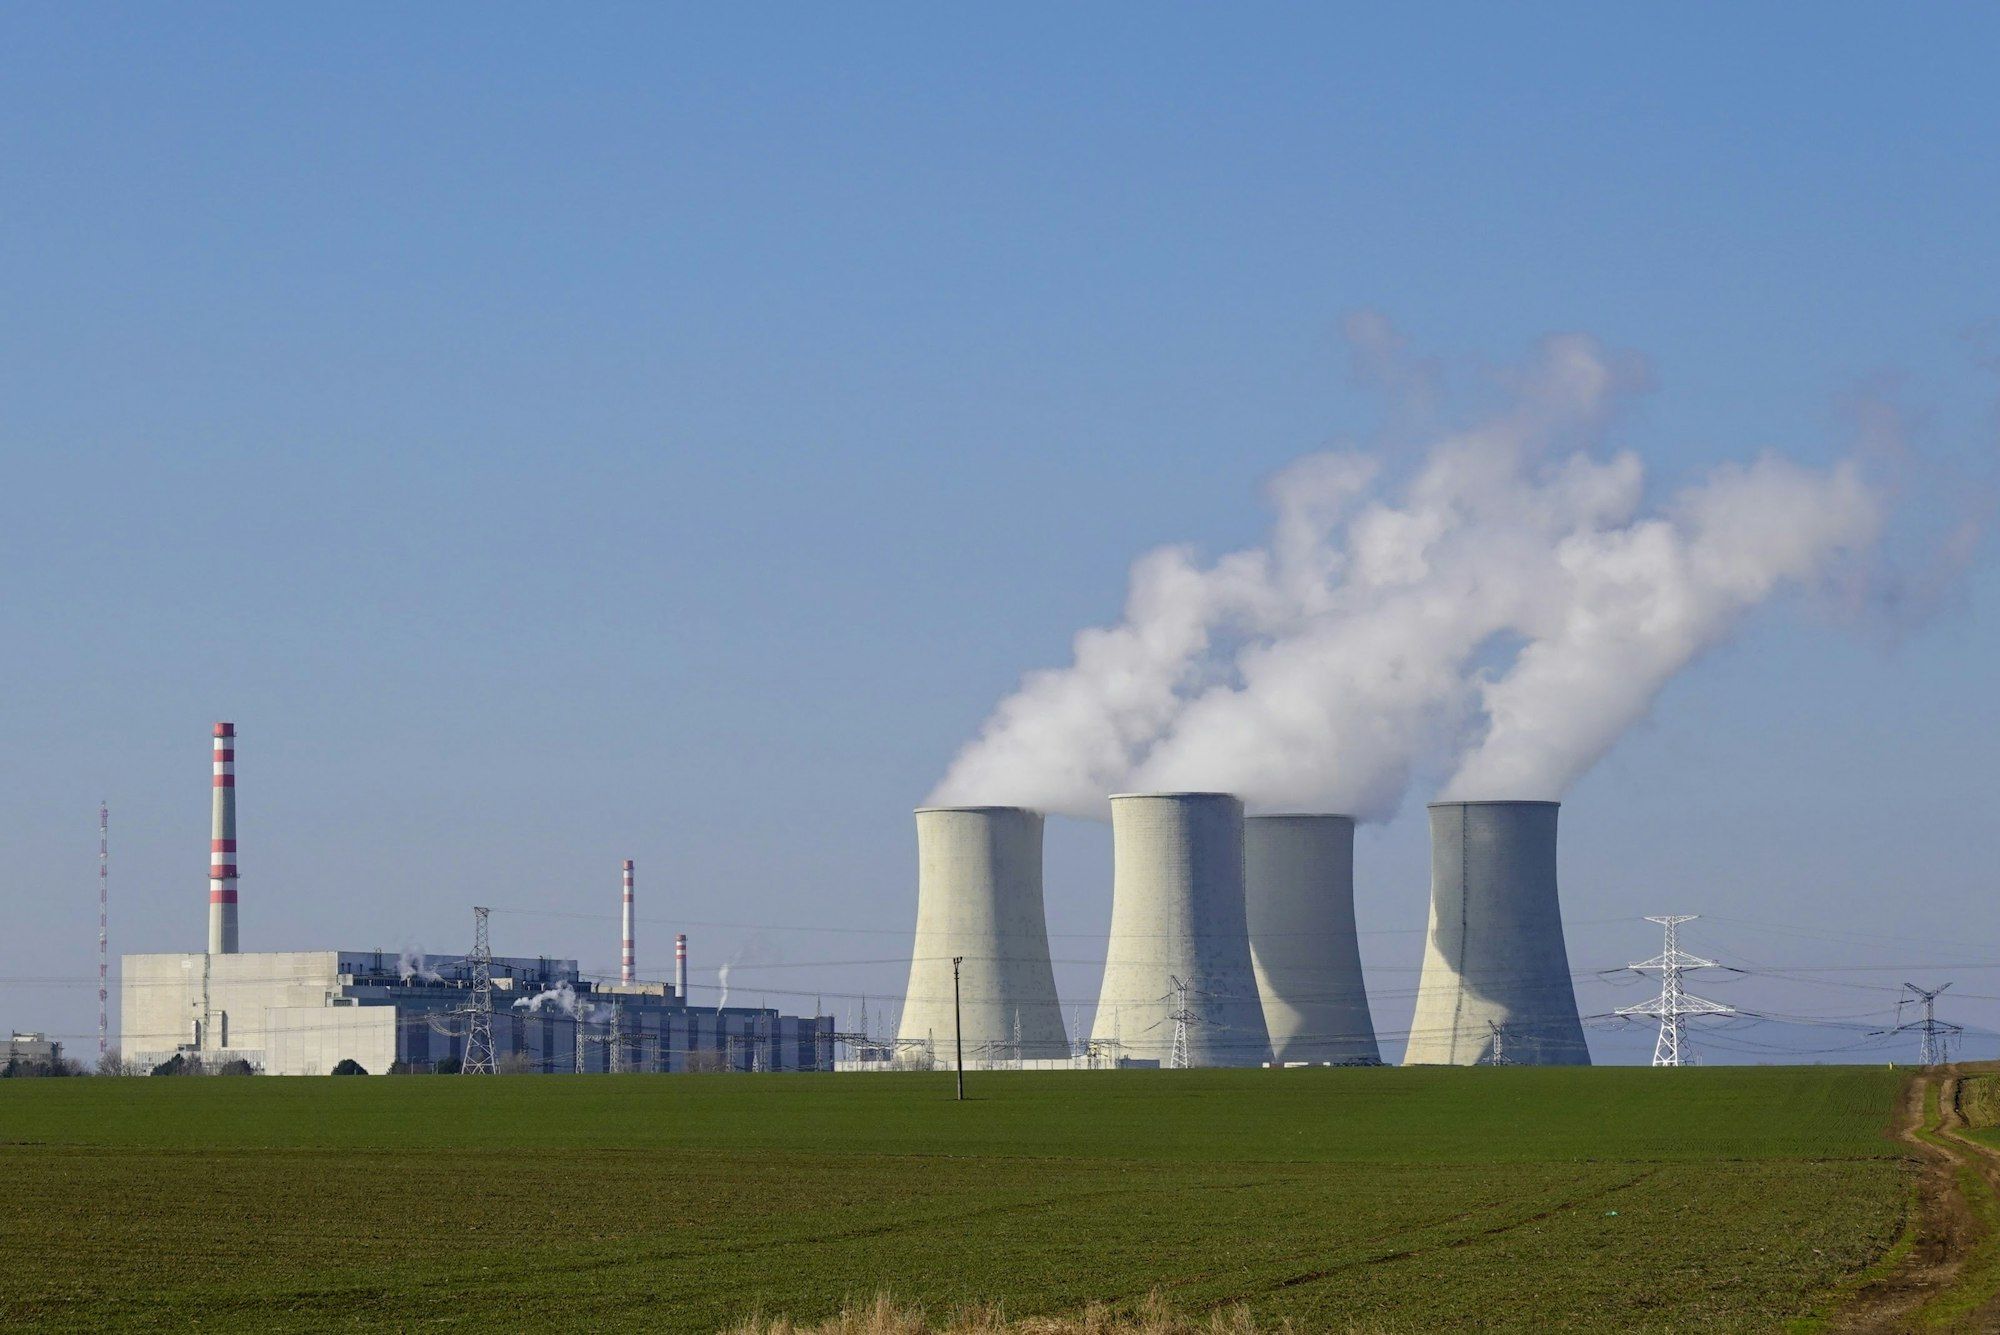
Recent Western nuclear plants were finished late and at high cost.
- Flamanville 3 (France). According to press reports, the first estimate was about 3.3 billion euros, with completion in 2012. The reactor connected to the grid on 21 December 2024. The French Court of Audit (Cour des comptes) calculated a total of 23.7 billion euros in January 2025 (2023 euros, with financing costs). EDF itself arrived at 22.6 billion. The two amounts are not directly comparable, because the price year differs.
- Olkiluoto 3 (Finland). Construction began in 2005 and regular production started on 16 April 2023, about fourteen years later than planned according to the press. It was a turnkey contract at a fixed price.
- Hinkley Point C (United Kingdom). In February 2026, EDF estimated £35 billion, in 2015 prices, so without inflation. In current prices the amount is higher. According to EDF, unit 1 will be ready in 2030, originally at the end of 2025. According to EDF, a further year of delay costs £1 billion.
- Vogtle 3 and 4 (US). Unit 4 entered commercial operation on 29 April 2024. According to AP reports, the project cost the owners more than $31 billion. Together with the $3.7 billion Westinghouse paid, the total comes close to $35 billion. At the start, the estimate was more than $14 billion. An official total from Georgia Power could not be found.
The NEA points out that these are mostly first-of-a-kind plants after years without construction. Experience from the 1970s and 1980s shows that later series became cheaper. Lazard assumes, on the advice of experts, that Vogtle 4 cost about 30% less than Vogtle 3.
You build solar and wind faster, but delays happen there too. One example is the Belgian North Sea, with about 2.3 GW of offshore wind. The Princess Elisabeth Zone, up to 3.5 GW, is delayed. The first tender of 700 MW was stopped in 2025. The government approved a new framework on 18 July 2026. The associated energy island has to be in place by 1 October 2031 at the latest. The framework still has to go to the Council of State and the European Commission. The island connects the wind farms to the mainland and, according to Elia (the grid operator), costs 3.6 billion euros for the first phase. For the whole project, amounts of 7 to at least 9 billion euros are quoted, depending on whether the British link counts. These are grid costs, not turbine costs.
Belgium at the end of October 2026
- 14 March 2025. The government and Engie reached an agreement on 10 extra years for Doel 4 and Tihange 3. The state and Engie each own half of the two reactors. A contract (contract for difference) lets the state and Engie share the price risk. The state took over responsibility for the waste.
- 15 May 2025. The Chamber of Representatives repealed the 2003 law. That removed most closure dates and the ban on new nuclear plants. For Doel 4 and Tihange 3, 2035 stays in the law, because of the agreement with Engie. No decision has been taken on a new nuclear plant.
- 10 July and 8 October 2025. Tihange 3 and Doel 4 returned to the grid, after approval by the FANC (Federal Agency for Nuclear Control).
- 30 April 2026. The government and Engie signed a letter of intent to take over all seven reactors. According to the Brussels Times of 30 April 2026, ongoing decommissioning and dismantling work at the Doel and Tihange plants is halted while the talks run. On 29 September, the VRT reported that no agreement would be ready on 1 October. The amount Engie has to pay in for decommissioning, 8 to 11 billion euros, is still open according to the VRT. According to the Brussels Times of 27 October (citing De Tijd and L'Echo), talks run until 4 November. A draft law for forced nationalisation is ready in case they fail. No official confirmation and no newer report could be found.
- Grid operator Elia. According to its press release, the June 2025 study covering 2026 to 2036 sees a need for extra capacity from 2028. Elia asks for long-term clarity and more flexibility. As options, Elia names, among others, extended or new nuclear plants, more offshore wind, more interconnectors and lower demand. Elia does not choose a technology. The full study could not be consulted.
Risks: where facts end
Accidents. Our World in Data sets studies side by side. It uses Markandya and Wilkinson (The Lancet, 2007) for fossil sources and Sovacool and colleagues (2016) for solar and wind. Result per TWh: coal about 25 deaths, oil 18, gas 3, hydropower 1.3, wind 0.04, nuclear power about 0.03 and solar about 0.02. The figures for fossil sources apply to European plants. For nuclear power, Our World in Data counts 433 deaths for Chernobyl and 2,314 for Fukushima, based on UNSCEAR and the Japanese government. In 2005 the WHO estimated up to 4,000 possible radiation deaths among the most exposed groups. Other studies estimate much higher. The figures differ widely.
Waste. NIRAS (the Belgian radioactive waste agency) chose deep geological disposal. According to NIRAS, the project will take many more decades. In the LCOE, decommissioning weighs little: for Belgium, the NEA counts about 0.56 dollars per MWh for a new nuclear plant and 0.54 to 0.81 for solar and wind. Fraunhofer does not count final disposal. The provisions for decommissioning are still being negotiated. According to the Brussels Times of 30 April 2026, Engie set aside 8.7 billion euros for this. The source of that figure (Synatom or the Commission for Nuclear Provisions) could not be found. In L'Avenir, a nuclear engineer believes 2.5 to 3 billion has to be added. Engie disputes projections of almost 3 billion more.
Dependencies. According to the Euratom Supply Agency, in 2024 Russia supplied 15.6% of the EU's natural uranium and 23.55% of its enrichment services. For enrichment it was 37.9% in 2023. The IEA wrote in 2022 that China held over 80% of every production step for solar. The new Belgian offshore tender limits Chinese turbines and components, according to offshorewind.biz.
Space. Lovering and colleagues (PLOS ONE, 2022) found the lowest median for nuclear power: 7.1 hectares per TWh a year. For the land use of the plants they used American data. Solar and wind take more space, depending on what you count.
CO2 and nature. According to the IPCC, wind and nuclear power emit 11 to 12 g CO2e per kWh over their lifecycle, large-scale solar 48, gas 490 and coal 820. These are medians with a wide spread. According to summaries, UNECE (2021) gives 5.1 to 6.4 for nuclear power and 7.8 to 16 for onshore wind. The report itself could not be consulted. In a 2020 presentation, the Royal Belgian Institute of Natural Sciences uses a calculation model to estimate 290 (plus or minus 205) collisions a year for the six most numerous bird species in Belgian wind farms. These are mostly gulls. A comparable Belgian figure for other sources could not be found.
Facts and choices. A study can measure costs, construction times and emissions, even if the assumptions differ. How much rare but large accident risk, how much waste for future generations and how much dependence on other countries a society accepts is a political choice. This article does not choose a technology for Belgium.
What now?
- When you hear a claim about costs, ask: is it about an existing or a new plant, and about which country and which year? An American figure says little about Belgium.
- Check whether "system costs" are included. An LCOE never includes them.
- Look up the source. See who produced it: a nuclear energy agency, a renewable energy agency or a bank.
- Do you want to know how Belgium plans to secure its electricity? Read Elia's scenarios at elia.be.
Sources and disclaimer
- OECD NEA and EPRI, The Costs of Generating Electricity 2025 (2026)
- IRENA, Renewable Power Generation Costs in 2025 (2026)
- Lazard, LCOE+ (July 2026)
- Fraunhofer ISE, Stromgestehungskosten Erneuerbare Energien (July 2024)
- IPCC AR5, Working Group III, Annex III (2014)
- Heptonstall and Gross, Nature Energy (2021)
- Sepulveda et al., Joule (2018)
- Brown et al., Renewable and Sustainable Energy Reviews (2018)
- Our World in Data, deaths per TWh
- Lovering et al., PLOS ONE (2022)
- Engie, agreement with the federal government (14 March 2025)
- VRT, nuclear phase-out law repealed (15 May 2025)
- VRT, takeover talks (29 September 2026)
- Brussels Times, Princess Elisabeth Island (7 September 2026)
- NIRAS-ONDRAF
- Cour des comptes via Connaissance des énergies (January 2025)
- World Nuclear News, Olkiluoto 3 (April 2023)
- Nuclear News (ANS), Vogtle 4 (29 April 2024)
- Brussels Times, Doel 4 back on the grid (15 October 2025)
- Brussels Times, takeover by the state (30 April 2026)
- L'Avenir (29 October 2026)
- offshoreWIND.biz, new framework for the Princess Elisabeth Zone (24 July 2026)
- Elia, adequacy and flexibility study 2026 to 2036 (press release, June 2025; copy on MarketScreener)
- Euratom Supply Agency, annual report 2024 (copy on another site)
- World Nuclear News, Hinkley Point C (23 January 2024, 2015 price basis)
- BEC Business Cluster, Hinkley Point C £35 billion (23 February 2026)
- Brussels Times, forced nationalisation (27 October 2026)
- WHO, Chernobyl (5 September 2005)
- IEA, Solar PV Global Supply Chains (2022)
- RBINS, bird monitoring at Belgian wind farms (presentation 2020)
This is general information, not personal advice. Figures and decisions can change. As of 30 October 2026.
Author: Wouter Hermans
Stay up to date with Bronsgroen
Once a month, news about our projects in Limburg, our activities and how you can take part. You can unsubscribe at any time.